In the world of data management, data leaders across many industries have claimed that a new paradigm has emerged, calling for the decentralization and simultaneous integration of data. Knowledge graphs are the heralded means of connecting disparate data across the organization, providing context with so-called ontologies by mimicking human logic in classifying and connecting relationships, and thereby empowering data democratization and explainable artificial intelligence.
Gartner predicts that the use of graph databases and applications will grow by 100 percent annually. Emil Eifrem, co-founder of Neo4j, a graph database platform, even states that new applications will soon no longer be built on relational databases. Sounds bold – almost too good to be true. In this short article we unpack what knowledge graphs really are, how they can change the course for financial institutions and how organizations can get started. Building upon Capco’s recent webinar – full recording is available here, we are providing a debrief into this complex topic.
You may have a story or two to tell about data siloes and the many challenges they’ve brought for your organization. Take customer data as an example – it is typically dispersed across several systems and incoherent. Connecting the links and collecting all relevant information about your customer can prove to be a Herculean task, fraught with duplicate identities, data inconsistencies and missing or outdated information across the board. Part of the problem here is perceived to be with the rigid structure of relational (SQL-style) databases.
This is where the appeal of knowledge graphs comes in. Rather than rigid schemas that were designed with specific goals in mind, knowledge graphs are flexible graph-based databases that have gained popularity and maturity in support of the “Friend-of-a-Friend” social networking systems (think FaceBook and LinkedIn). They are based upon the proposition that domains are inherently graph-based rather than table-oriented, and that value is best derived from relationships that connect business domains.
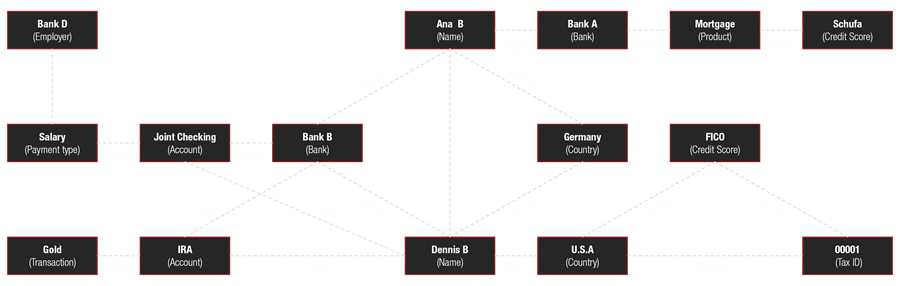
Entities, such as a customer, are represented within ontologies as nodes with attributes, and are connected by relationships that can have further attributes. A specialized query language is then used to quickly navigate the graph structure when nodes and relationships are populated. Rather than joins upon joins, which are not performant in terms of memory and CPU, knowledge graphs allow for fast ad-hoc querying that allows for identifying relationships that are difficult to discern by other means. Imagine a query that links your customer to a product that is suited for their non-customer spouse’s newly forming small business operation. Or a query that identifies a fraudulent transaction by identifying an unusual series of highly usual events. A visual of an intricate spider web provides an illustration.
Serving as building blocks for knowledge graphs, taxonomies organize content and provide context to data entities using labels and basic relations.
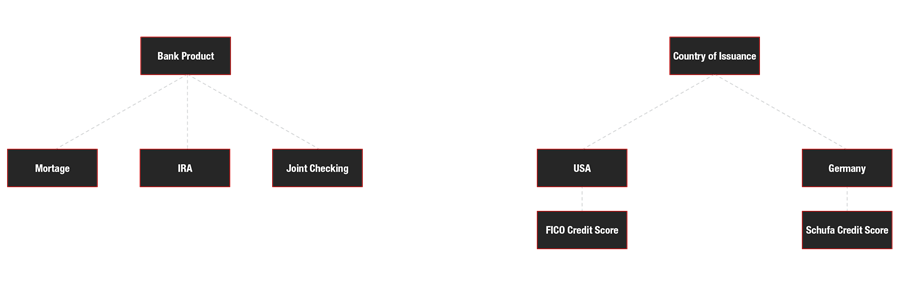
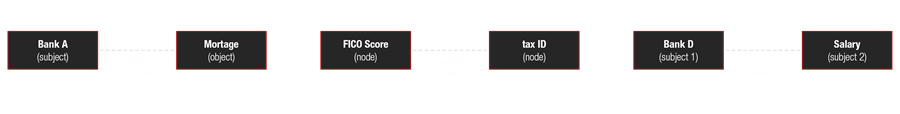
Like schemas, ontologies define things, describe them and assign relationships to them in a repeatable and scalable manner, typically in three parts known as triplets. In triplets, the subject and object comprises a node, while the relationship comprises an edge.
Based upon taxonomies and ontologies as structural components, knowledge graphs tie together the context in data and depict the nodes and edges in a visual manner.
Put short, knowledge graphs are about relationships at scale. They excel in explaining how people, places and things relate, by connecting structured with unstructured data and pulling together disparate information in a less expensive way. In a world that is becoming increasingly connected, it does in fact make sense to consider relationships as key features of data with the ability to constantly evolve, rather than as implied features using decades-old primary and foreign keys.
You may have heard of the promise of generating value through connected data in a different context, perhaps through data catalogues, data fabrics, or other forms of semantic layers. And knowledge graphs are not so far removed from the myriad of data management solutions that are rising to address the need of connected data. In fact, many data management solutions are built on knowledge graph databases, and this is how they can offer flexibility and ease of access to the business user.
Semantic web technologies are coming into place in the form of bridges offering the benefits of linked data, as relational databases are inextricable and deeply engrained within organizations. Sure, perhaps one day new databases will be built on knowledge graph databases rather than relational databases. But in the meantime, semantic web technologies are coming in to fill the void.
The main takeaway here is that connected data is powerful, in fact it is so powerfully transformative that we believe financial institutions will need to embrace connected data if they want to remain competitive over the coming years. However, connecting data does not mean hiring a squad of data engineers that will map your entire enterprise data onto ontologies that will enable the development of new knowledge graph databases. In the wake of data democratization initiatives that are already in place within many organizations, our recommendation is rather for organizations to test the benefits of semantic technologies for themselves with small, agile use cases.
Want to discover the potential cross-organizational benefits of knowledge graphs for yourself? Well for one, don’t shy away from employing a data catalogue or a low-code bridge solution of the likes that can introduce your organization to the value of connected data – there’s no need to reinvent the wheel. Yet even with a semantic web technology in place, there’s no circumnavigating the act of applying context and meaning to your data. Here’s a few tips for getting started:
And lastly, stay tuned for upcoming blog posts that will explore the usage and requirements of knowledge graph implementations for each of the mentioned use cases.
Anastasia Berzhanin
Michael Feiler, Executive Director
M +49 172 698 7299
E michael.feiler@capco.com