There is nothing particularly groundbreaking about technology organizations adopting Agile frameworks to deliver value. In fact, global companies such as Spotify, the LEGO Group, and Adobe have been adopting an Agile mindset into their working models for a considerable period of time now.
Likewise, Agile ways of working have also been adopted in many areas of financial services. However, one blocker preventing some financial services firms adopting modern delivery more rapidly is the fear Agile ways of working come with less governance and, therefore, reduced oversight. This blog aims to bust that myth by focusing on one particularly useful artefact: the burn up/burn down chart.
For the benefit of suspicious change management professionals, let me explain how these fuss-free looking charts can actually benefit you and, when used correctly, offer more governance assurance and control than the traditional milestone Plan on a Page.
How many times have you found yourself in a Plans Vs Progress meeting reviewing cluttered milestone plans and explaining that yet another milestone has been missed? These conversations are often followed by further long discussions about the intricacies of whether or not said milestone is now Red or Amber. And, to add salt to the wound, does PMO even know Change Control process?
Consequently, the Change team doesn’t make it past the first workstream swim lane. They pick up in two weeks, rinse and repeat. Sound familiar? In my experience, many of these traditional Plan on a Page meetings simply can’t provide the focus required to enable a project team to drill down to the real point of PMO and best practices: providing governance which supports us in answering the question ‘what is the blocker and how can we resolve it?’
So, how can we use Agile artefacts to quickly deliver change that can be tracked in a highly controlled environment, such as financial services? When used correctly, burn up/burn down charts display progress completed and work left to be completed, reducing uncertainty and any of the unnecessary discussion and debate generated from complicated milestone plans.
A burn up chart will have a forecast line which corresponds to the total work planned. If there is a ‘bump’ in the forecast line, the Scrum Master or Agile PMO can deduce that work has been added to the backlog, indicating an increase in scope. This encourages the Scrum team to go back to the product backlog and revisit the requirements. They can then pivot accordingly by reprioritizing the team’s activities as required. In Scrum terms, this is called ‘grooming (or refining) of the backlog.’
The scenario in which the project manager’s multi-coloured milestones become a surprise is avoided up-front and any waste of effort and time is reduced. In effect, the burn up chart has anticipated a blocker hindering progress and has enabled the teams to mitigate this blocker.
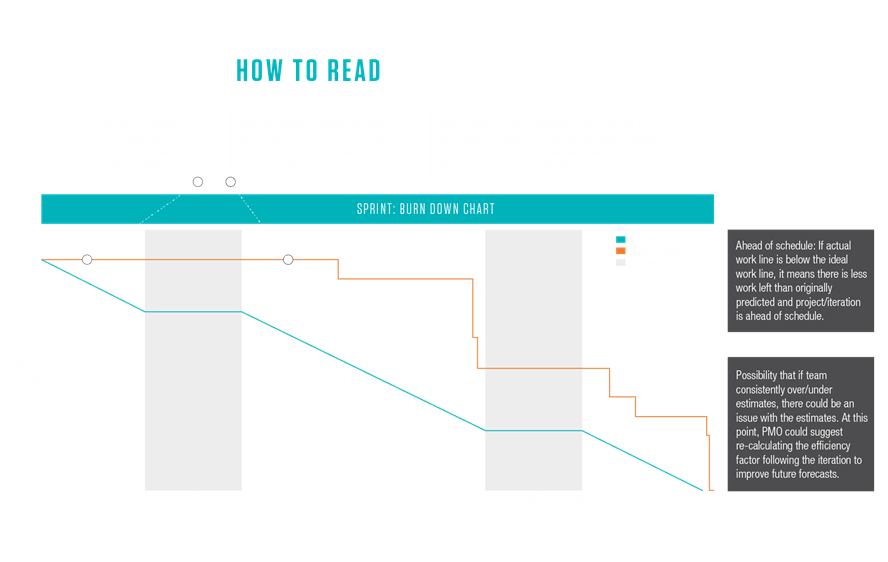
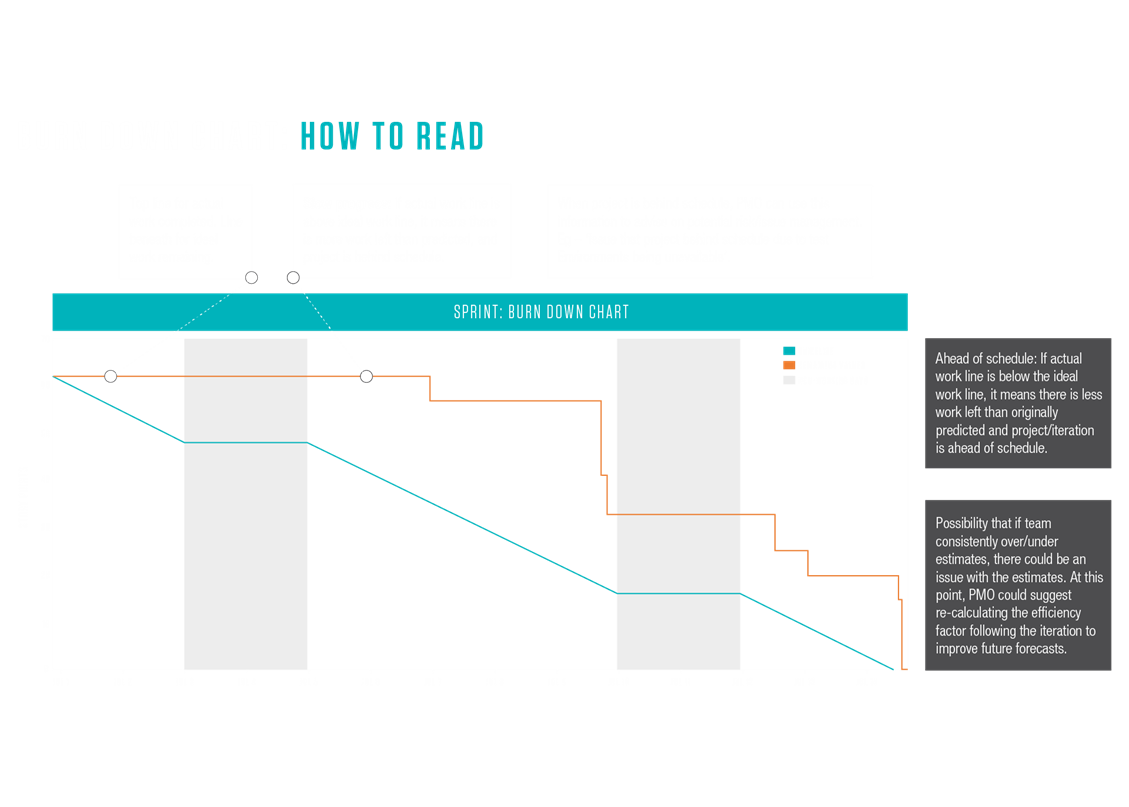
Burn down charts are even less likely to be well understood by a senior audience in financial services than a burn up hart. Typically used by Scrum Masters to manage their individual Scrums, they are used to provide a quick snapshot of where the Scrum (or pod) is in any given iteration. An astute PMO, well trained in Agile governance, can determine and quickly escalate to the senior audience any emerging risks these charts may subtly betray.
Picture the scene, Janet the Scrum Master in the Scrum of Scrums is consistently displaying a burn down chart where the actual work line is below the ideal work line. Objectively, this means her pod is consistently significantly ahead of schedule. Well done, Janet! Or so it seems. Actually, the PMO suspects there is a fundamental issue with how the story points in Janet’s Scrum are prescribed to the tasks. Whilst each sprint seems to be worthy of a communal pat on the back in the Scrum meetings, the PMO identified that planning and resource utilisation across the portfolio is being adversely affected by resources prematurely becoming free whilst not being re-assigned to other tasks. Janet is inadvertently slowing down progress in other areas. Having identified the trend, the PMO quickly escalates to senior management, with the suggestion that unless Janet’s pod really are super-charged with their morning Weetabix every day, then the mechanism for estimating work required for completing tasks needs to be urgently revisited. Precise examples can be provided of where delivery elsewhere can be accelerated and therefore benefit realised if this acted upon. This really is a case of PMO weeding the garden!
The PMO is instrumental in harnessing Agile tooling in a financial services environment. Through utilising their in-depth knowledge of burn down/burn up charts, alongside other Agile artefacts, and data, they can influence and steer the team on a range of fundamental elements throughout the agile cycle. This includes, but is not restricted to, giving guidance on risks and issues, providing counsel on project and programme status updates, and building processes that can add real value to senior stakeholders’ understanding of delivery. Perhaps most importantly, they can help keep auditors satisfied in this heavily regulated environment.
If you want to learn more about Agile tooling and the capability we have at Capco:https://www.capco.com/about-us/be-yourself-at-work/luke-isbel-agile-coach-tooling-optimisation-geek.